Table of Contents
dissolved oxygen sensor Applications in Aquaculture Water Quality Management
Key Takeaways:
– Global aquaculture production reaches 120 million metric tons in 2026, requiring advanced water quality management
– Dissolved oxygen monitoring reduces aquaculture mortality by 25-40% through early stress detection
– Optimal DO levels of 5-8 mg/L increase fish growth rates by 35% compared to suboptimal conditions
– Real-time DO monitoring prevents economic losses averaging $50,000-500,000 per farm annually
– Sensor technology selection determines 60% of monitoring system reliability in aquaculture environments
Dissolved oxygen (DO) represents the most critical water quality parameter in aquaculture operations, directly determining aquatic organism health, growth rates, feed conversion efficiency, and ultimately farm profitability. Unlike terrestrial animal production, aquaculture species depend entirely on dissolved oxygen concentration in their aqueous environment, with oxygen levels frequently becoming the limiting factor for production density and system productivity. Understanding dissolved oxygen measurement principles, sensor technologies, and management strategies enables aquaculture operations to optimize production while minimizing losses from hypoxia-related mortality.
Understanding Dissolved Oxygen in Aquaculture
The Critical Role of Dissolved Oxygen
Dissolved oxygen concentration in water directly affects every aspect of aquatic organism physiology:
Respiration: Fish, shrimp, and other aquatic organisms extract oxygen from water through gill ventilation. DO concentrations below critical thresholds force organisms to expend increasing energy on respiration, diverting metabolic resources from growth and immune function.
Metabolism: Metabolic rate correlates directly with DO availability. Research published in the Journal of the World Aquaculture Society demonstrates that DO levels below 4 mg/L reduce feed conversion efficiency by 30-40% as organisms consume more feed but divert energy to respiration rather than growth.
Immune Function: Chronic exposure to suboptimal DO conditions suppresses immune system function, increasing susceptibility to bacterial, viral, and parasitic diseases. The Food and Agriculture Organization (FAO) estimates that 30% of aquaculture disease outbreaks relate directly or indirectly to inadequate water quality, with DO deficiency as a primary contributor.
Optimal DO Requirements by Species
Different aquaculture species exhibit varying DO requirements:
| Species | Minimum DO (mg/L) | Optimal DO (mg/L) | Critical DO (mg/L) |
|---|---|---|---|
| Atlantic salmon | 5.0 | 8-10 | 3.0 |
| Channel catfish | 3.0 | 5-7 | 2.0 |
| Pacific white shrimp | 3.0 | 5-8 | 2.0 |
| Tilapia | 2.0 | 5-6 | 1.0 |
| Largemouth bass | 4.0 | 6-8 | 2.5 |
| Hybrid striped bass | 4.0 | 6-8 | 3.0 |
Understanding species-specific requirements enables appropriate monitoring strategies and management responses.
Factors Affecting Dissolved Oxygen
DO concentration results from the balance between oxygen addition and consumption:
Oxygen Addition Sources:
- Atmospheric diffusion: Surface aeration transfers oxygen from air to water
- Mechanical aeration: Aerators increase surface area and mixing, enhancing diffusion
- Photosynthesis: Aquatic plants and algae produce oxygen during daylight hours
- Water exchange: Freshwater input introduces oxygenated water
Oxygen Consumption Sources:
- Respiration: Fish, shellfish, and aquatic organisms consume oxygen continuously
- Bacterial respiration: Decomposition of organic matter by bacteria consumes significant oxygen
- Chemical oxidation: Oxidation of reduced compounds (ammonia, nitrite, sulfide) consumes oxygen
- Sediment oxygen demand: Bottom sediments consume oxygen from overlying water
This balance creates diurnal DO patterns, with peak concentrations in late afternoon and minimum concentrations in early morning hours—often the most critical period for aquaculture operations.
Sensor Technologies for Aquaculture
Membrane-Covered Electrodes (Polarographic and Galvanic)
Operating Principle: Oxygen permeable membrane separates sensor electrodes from water sample. Oxygen diffusion through membrane creates electrical current proportional to oxygen concentration.
Polarographic Sensors:
- Require external power for electrode polarization
- Initial polarization time of 15-30 minutes
- Membrane replacement typically 3-6 months
- Excellent accuracy and stability
Galvanic Sensors:
- Self-powered through chemical reaction
- Immediate operation without polarization
- Lower maintenance requirements
- Excellent for remote installations
Advantages for Aquaculture:
- Proven technology with extensive industry experience
- Stable readings in varying aquaculture conditions
- Cost-effective for routine monitoring applications
Limitations:
- Membrane fouling in biologically active waters
- Temperature sensitivity requiring compensation
- Flow dependency at very low velocities
ChiMay galvanic DO sensors provide extended membrane life exceeding 6 months in aquaculture applications through advanced membrane formulations.
Optical Fluorescence Sensors
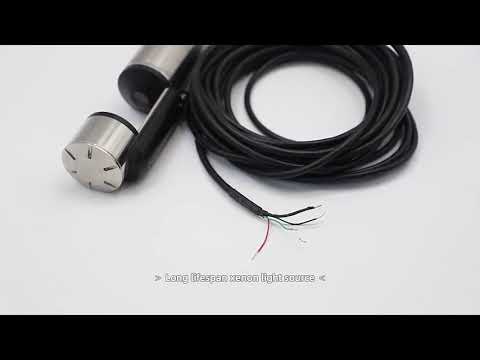
Operating Principle: Luminescent sensor coated with oxygen-sensitive fluorescent dye. Oxygen quenches fluorescence intensity and lifetime proportionally to oxygen partial pressure.
Advantages for Aquaculture:
- Minimal flow dependency enabling accurate measurement in low-flow conditions
- Excellent fouling resistance from anti-fouling optical coatings
- Rapid response to DO changes
- No oxygen consumption by sensor (non-consuming measurement)
- Extended calibration intervals of 6-12 months
Limitations:
- Higher initial cost than membrane electrodes
- Light sensitivity requiring protection from direct sunlight
- Temperature compensation required for best accuracy
ChiMay Optical DO sensors incorporate proprietary anti-fouling coatings that maintain measurement accuracy in demanding aquaculture environments, with 12-month calibration intervals reducing maintenance burden.
Sensor Selection Criteria for Aquaculture
| Application | Recommended Technology | Key Features |
|---|---|---|
| Pond monitoring | Optical | Low maintenance, anti-fouling |
| Raceway monitoring | Galvanic or Optical | Continuous flow, rapid response |
| Tank-based systems | Optical | Minimal flow requirement |
| Cage culture | Galvanic | Simple operation, cost-effective |
| Recirculating systems | Optical or Galvanic | Stable readings, minimal maintenance |
Monitoring System Design
Monitoring Point Placement
Strategic sensor placement maximizes monitoring value:
Pond Systems:
- Multiple depth locations: Surface and bottom readings reveal stratification
- Multiple locations: Monitor DO variation across pond area
- Upstream of aeration: Measure pre-aeration conditions
- Critical areas: Position near animal stocking density peaks
Raceway and Flow-Through Systems:
- Inlet and outlet: Measure oxygen utilization through system
- Multiple raceways: Monitor individual unit performance
- Near fish density: Measure DO at point of maximum consumption
Tank-Based Systems:
- Multiple tank monitoring: Each tank requires representative measurement
- Drain line monitoring: Continuous outflow measurement
- Recirculation loop: Monitor treatment system performance
Alarm and Control Integration
Alarm Configuration:
- Critical low alarms: Immediate notification at 2-3 mg/L (species dependent)
- Warning alarms: Early notification at 4-5 mg/L enabling proactive response
- High alarms: May indicate algae blooms or measurement issues
Automated Response Systems:
- Aerator activation: Automatic aeration when DO falls below threshold
- Paddle wheel control: Speed adjustment based on DO levels
- Feeder restriction: Reduce or stop feeding during low DO conditions
- Water exchange: Initiate water exchange when DO cannot be maintained
ChiMay DO sensors integrate with PLC and SCADA systems enabling comprehensive alarm and control integration for automated aquaculture management.
Data Logging and Analysis
Continuous Monitoring Benefits:
- DO trend analysis revealing daily and seasonal patterns
- Early warning of developing problems
- Historical records for management optimization
- Compliance documentation for certification requirements
Data Analysis Applications:
- Diurnal pattern analysis: Identify peak and minimum DO times
- Correlation analysis: Relate DO to feeding, weather, and production data
- Predictive modeling: Forecast DO requirements based on environmental conditions
Management Strategies
Aeration Management
Aerator Sizing:
- Calculate oxygen deficit: (Target DO – Current DO) × Flow rate
- Size aeration capacity for worst-case morning conditions
- Include safety factor of 20-30% for unexpected conditions
Aeration Scheduling:
- Pre-dawn operation anticipates minimum DO conditions
- Variable speed aerators adjust to actual demand
- Oxygen distribution through proper aerator placement
Stocking Density Management
DO availability limits effective stocking density:
Density Calculation:
- Maximum sustainable density depends on system oxygen supply capacity
- Summer conditions require 30-40% lower density than winter
- Monitor DO trends when evaluating density increases
Split-Pond Systems:
- Separate animal and treatment zones
- Concentrate animals in limited area with dedicated aeration
- Enables higher overall densities with lower capital costs
Seasonal Management
Summer Challenges:
- Higher temperatures reduce oxygen solubility
- Higher metabolic rates increase oxygen demand
- Algae blooms cause diurnal DO swings
- Strategies: Reduce density, increase aeration, emergency response plans
Winter Considerations:
- Lower temperatures increase oxygen solubility
- Reduced metabolic rates decrease oxygen demand
- Ice cover limits atmospheric aeration
- Strategies: Maintain minimum aeration, monitor for winterkill conditions
Economic Analysis
Investment Justification
DO monitoring investment delivers substantial returns:
Mortality Prevention:
- Typical aquaculture mortality of 10-20% annually
- 25-40% of mortality relates to water quality, primarily DO
- DO monitoring prevents $50,000-500,000 in losses at commercial facilities
- Monitoring investment of $5,000-25,000 typically pays back within 3-12 months
Growth Optimization:
- Optimal DO increases growth rates by 20-35%
- Improved FCR reduces feed costs by 15-25%
- Reduced cycle times increase production capacity
- Combined benefits often exceed $0.50 per kilogram of production
Cost-Benefit Analysis
| Investment | Annual Cost | Annual Benefit | Payback |
|---|---|---|---|
| DO monitoring system | $3,000 | $45,000 | 1 month |
| Aeration equipment | $15,000 | $35,000 | 5 months |
| Automated control system | $25,000 | $60,000 | 5 months |
| Total integrated system | $40,000 | $120,000 | 4 months |
Troubleshooting Common Issues
Measurement Problems
| Issue | Cause | Solution |
|---|---|---|
| Unstable readings | Membrane fouling | Clean or replace membrane |
| Low readings | Biological fouling | Clean sensor, apply anti-fouling measures |
| No response | Membrane damage | Replace membrane |
| Slow response | Boundary layer effects | Increase flow past sensor |
Management Challenges
| Challenge | Indicator | Response |
|---|---|---|
| Persistent low DO | Morning readings <3 mg/L | Increase aeration, reduce density |
| Diurnal swings | DO variation >5 mg/L daily | Add nighttime aeration, reduce feeding |
| Sudden drops | Rapid DO decline | Emergency aeration, investigate cause |
| Uneven distribution | DO varies across system | Improve water circulation |
Conclusion
Dissolved oxygen monitoring represents essential infrastructure for professional aquaculture operations, directly determining production success through effects on animal health, growth, and survival. The substantial economic losses from inadequate DO management—averaging $50,000-500,000 per commercial facility annually—provide compelling justification for comprehensive monitoring investment.
Effective DO management requires appropriate sensor technology selection, strategic monitoring point placement, reliable alarm and control integration, and informed operational responses to monitoring data. The investment required for comprehensive DO monitoring—typically $5,000-25,000 per facility—delivers payback within months through prevented losses and production optimization.
ChiMay’s aquaculture-optimized DO sensors address the demanding requirements of aquatic production environments with technologies engineered for reliability, accuracy, and minimal maintenance. Our aquaculture specialists support customers in designing monitoring strategies optimized for specific production systems and species requirements.
Tags: dissolved oxygen sensor, aquaculture, water quality monitoring, fish farming, shrimp farming, DO management