Table of Contents
Key Takeaways
Turbidity serves as one of the most critical water quality indicators in municipal treatment operations. This optical measurement quantifies suspended particles that affect both aesthetic quality and treatment effectiveness. Traditional monitoring through periodic grab sampling provides snapshot data that misses important variations between sampling intervals. Online turbidity monitoring transforms treatment optimization by providing continuous data streams that enable proactive process control and regulatory compliance demonstration.
Enhanced Filtration Performance
Continuous turbidity monitoring provides immediate feedback on filter effectiveness that periodic sampling cannot match. When filter media approaches exhaustion, turbidity breakthrough provides early warning before contaminated water reaches distribution systems. The American Water Works Association (AWWA) reports that 73% of filter failure events produce measurable turbidity increases that automated monitoring would detect within minutes. Grab sampling frequency rarely catches these transient events.
The relationship between raw water turbidity and coagulant dosing requirements changes continuously as source water conditions fluctuate. Storms, seasonal runoff, and algal blooms alter particle characteristics that influence optimal treatment conditions. Online turbidity monitoring enables coagulation optimization that responds to these variations within minutes rather than hours. The Water Research Foundation documented 28% coagulant savings when continuous turbidity data drove automated dosing compared to traditional operator-adjustment approaches.
Distribution System Protection
Filtered water turbidity monitoring provides the last line of defense before water enters the distribution system. Regulatory standards limit finished water turbidity to 1 NTU as a maximum and 0.3 NTU for 95% of measurements. Online monitoring with automated alarm generation ensures immediate response when limits approach, preventing exceedances that could trigger regulatory action. The U.S. Environmental Protection Agency Surface Water Treatment Rule explicitly recognizes continuous turbidity monitoring as an acceptable compliance verification method.
Microbial contamination in distribution systems often manifests through increased turbidity from biofilm disturbance or pipe corrosion products. Continuous monitoring detects these events faster than scheduled sampling, enabling accelerated investigation and corrective action. The Centers for Disease Control and Prevention documentation of waterborne disease outbreaks consistently identifies delayed detection as a factor enabling outbreak propagation. Real-time monitoring directly addresses this vulnerability.
Chemical Optimization Benefits
Coagulation and flocculation processes consume significant treatment chemicals that online turbidity monitoring can optimize. The dose-response relationship between coagulant addition and turbidity removal varies with raw water characteristics including pH, temperature, and particle concentration. Continuous turbidity data enables closed-loop control algorithms that maintain optimal coagulant dosing despite source water variations. The University of Illinois treatment plant pilot study demonstrated 22% coagulant reduction through automated optimization.
Flocculation tank turbidity profiles reveal floc formation quality that influences subsequent sedimentation and filtration performance. Multiple monitoring points across flocculation trains provide spatial data for process optimization. Aggregate size and density correlate with turbidity levels, enabling operators to adjust mixing energy and detention times for optimal floc formation. These adjustments translate directly to improved finished water quality and reduced filter backwash requirements.
The EPA estimates that optimized coagulation at U.S. water treatment facilities could save $50 million annually in chemical costs while simultaneously improving treatment effectiveness. Online turbidity monitoring represents the foundational technology enabling this optimization, providing the measurement precision and response time necessary for automated control implementation.
Filter Backwash Optimization
Filter backwash operations consume substantial volumes of treated water and impose significant energy demands for pump operation. Traditional backwash scheduling based on elapsed time or head loss accumulation fails to account for actual filter loading conditions. Continuous turbidity monitoring enables backwash initiation based on breakthrough detection, extending filter runs during low-loading periods while preventing excessive turbidity during high-loading conditions.
The Water Environment Federation best practices document recommends turbidity-based backwash initiation as the preferred approach for filter optimization. Studies at full-scale treatment facilities demonstrate 15-25% reductions in backwash water consumption when turbidity-driven control replaces time-based scheduling. Energy consumption for backwash pumping decreases proportionally with reduced water volumes.
Regulatory Compliance Advantages
The Safe Drinking Water Act mandates turbidity monitoring with specific requirements for treatment plant compliance demonstration. Online monitoring generates continuous data records suitable for regulatory reporting without manual transcription errors or falsification risks. The EPA promulgated regulations explicitly supporting continuous monitoring as equivalent to grab sampling for compliance determination, provided instruments meet specified accuracy requirements.
Chronic turbidity exceedances can trigger enforcement actions including mandatory operational changes, infrastructure requirements, and civil penalties. The American Water Works Association compliance survey indicates that facilities with continuous monitoring achieve 99.2% time-in-specification rates compared to 94.8% for facilities relying primarily on periodic sampling. This compliance performance difference carries significant regulatory relationship implications.
Data Quality Improvement
Continuous monitoring data provides statistical confidence that periodic sampling cannot achieve. Average turbidity calculations using continuous data reflect actual system performance throughout the monitoring period. Grab sample extrapolation to reporting period averages introduces statistical uncertainty that may not satisfy regulatory expectations for accurate compliance demonstration.
Electronic data logging eliminates transcription errors that plague manual recording systems. The EPA audit findings consistently identify data transcription errors as a common compliance documentation deficiency. Automated data capture from online instruments directly addresses this vulnerability while reducing operator workload for routine monitoring documentation.
Operational Efficiency Gains
Real-time turbidity data enables operators to identify treatment process deviations before they escalate to quality exceedances. Trend analysis reveals gradual changes indicating equipment degradation or source water quality shifts requiring attention. This predictive capability transforms treatment operations from reactive response to proactive management, reducing emergency interventions and associated costs.
The AWWA Operations and Management Division case study compilation documents numerous facilities achieving 20-30% reductions in overall treatment costs through continuous monitoring implementation. These savings derive from chemical optimization, filter efficiency improvements, and reduced emergency maintenance events. The capital investment in monitoring equipment generates returns well exceeding typical industrial project hurdle rates.
ChiMay Turbidity Solution Features
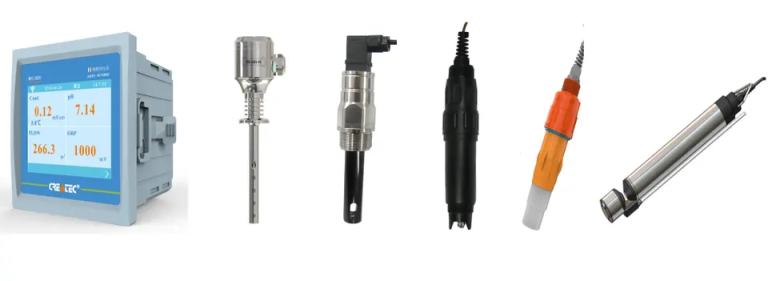
ChiMay online turbidity sensors meet EPA Method 180.1 accuracy requirements through nephelometric measurement principles. The ISO 7027-compliant infrared light source provides stable illumination without temperature drift affecting measurement accuracy. Measurement range from 0-4000 NTU covers all municipal water treatment applications with automatic range switching eliminating operator intervention during turbidity spikes.
The sensor’s self-cleaning mechanism utilizes compressed air or water spray to prevent fouling that degrades measurement accuracy between maintenance visits. This automatic cleaning extends calibration intervals to 3-6 months under typical conditions while maintaining measurement accuracy specifications. The IP68 sensor housing rating enables permanent submersion in sampling chambers without protective enclosures.
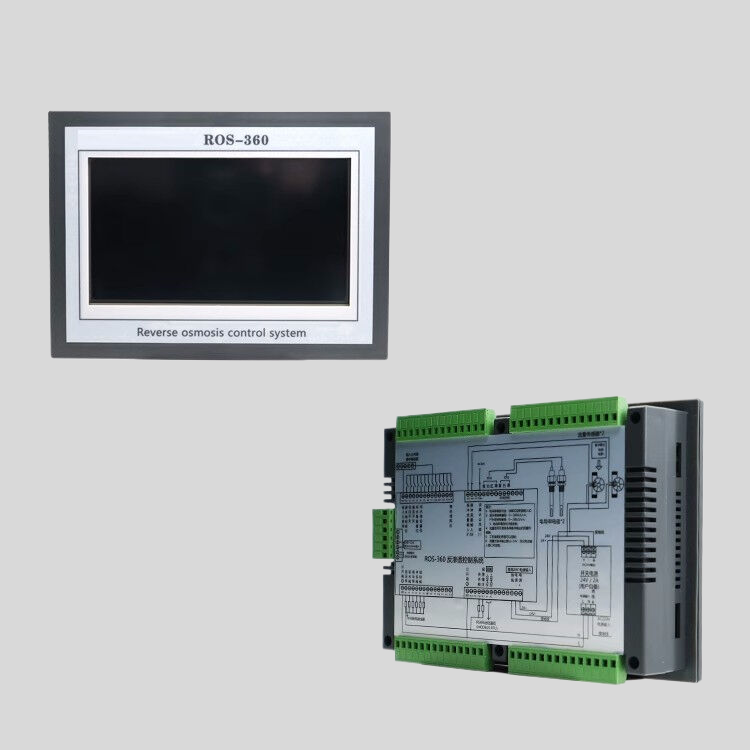
Integration with treatment plant control systems through 4-20 mA output or Modbus RTU/TCP digital communication provides seamless data transmission. Alarm relay contacts enable direct connection to plant SCADA systems for automated response coordination. The modular sensor design permits field replacement of optical components without returning the complete instrument for service.