Table of Contents
Understanding the Importance of Water Quality Monitoring Reports
Water quality monitoring reports are essential tools in the management and preservation of our most precious resource: water. These reports provide a comprehensive analysis of the physical, chemical, and biological characteristics of water, offering valuable insights into its overall quality and safety. Understanding the importance of these reports is crucial for both individuals and communities, as they play a pivotal role in ensuring the health and wellbeing of the population and the environment.
Water quality monitoring reports are typically generated by environmental agencies or water treatment facilities. They are based on regular testing and analysis of water samples from various sources, including rivers, lakes, groundwater, and municipal water supplies. The data collected provides a snapshot of the water’s current condition, revealing any potential issues or threats. This information is vital for decision-making processes related to water management, pollution control, and public health.
One of the primary purposes of water quality monitoring reports is to ensure compliance with environmental and health regulations. Different countries have established standards for water quality, which set permissible limits for various contaminants. These may include harmful bacteria, heavy metals, pesticides, and other pollutants. By regularly monitoring water quality, authorities can ensure that these standards are being met, taking corrective action if necessary.
Moreover, these reports serve as an early warning system for potential health risks. For instance, high levels of certain contaminants, such as lead or E.coli bacteria, can pose serious health risks. Regular monitoring allows for the early detection of such threats, enabling swift action to protect public health. This is particularly important in densely populated urban areas, where water contamination can have far-reaching impacts.
Water quality monitoring reports also play a crucial role in the management of natural resources. They provide essential data for the sustainable management of water bodies, helping to preserve biodiversity and maintain ecological balance. For example, monitoring the levels of nutrients in a lake can help prevent harmful algal blooms, which can devastate local ecosystems.
Furthermore, these reports contribute to scientific research and understanding. The data collected can help scientists track long-term trends and changes in water quality, contributing to our understanding of environmental issues such as climate change and pollution. This information can inform policy decisions and guide future research, helping to shape a more sustainable future.
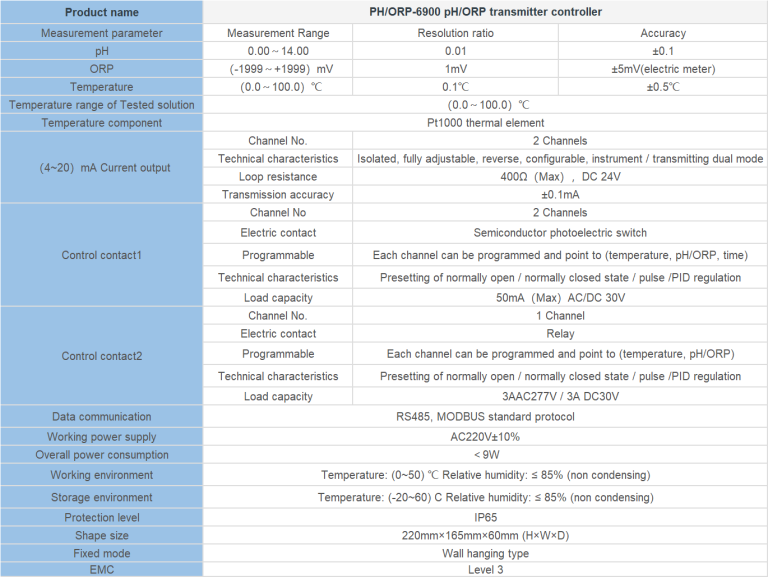
| Product name | PH/ORP-6900 pH/ORP transmitter controller | ||
| Measurement parameter | Measurement Range | Resolution ratio | Accuracy |
| pH | 0.00~14.00 | 0.01 | ±0.1 |
| ORP | (-1999~+1999)mV | 1mV | ±5mV(electric meter) |
| Temperature | (0.0~100.0)℃ | 0.1℃ | ±0.5℃ |
| Temperature range of Tested solution | (0.0~100.0)℃ | ||
| Temperature component | Pt1000 thermal element | ||
| (4~20)mA Current output | Channel No. | 2 Channels | |
| Technical characteristics | Isolated, fully adjustable, reverse, configurable, instrument / transmitting dual mode | ||
| Loop resistance | 400Ω(Max),DC 24V | ||
| Transmission accuracy | ±0.1mA | ||
| Control contact1 | Channel No | 2 Channels | |
| Electric contact | Semiconductor photoelectric switch | ||
| Programmable | Each channel can be programmed and point to (temperature, pH/ORP, time) | ||
| Technical characteristics | Presetting of normally open / normally closed state / pulse /PID regulation | ||
| Load capacity | 50mA(Max)AC/DC 30V | ||
| Control contact2 | Channel No. | 1 Channel | |
| Electric contact | Relay | ||
| Programmable | Each channel can be programmed and point to (temperature, pH/ORP) | ||
| Technical characteristics | Presetting of normally open / normally closed state / pulse /PID regulation | ||
| Load capacity | 3AAC277V / 3A DC30V | ||
| Data communication | RS485, MODBUS standard protocol | ||
| Working power supply | AC220V±10% | ||
| Overall power consumption | <9W | ||
| Working environment | Temperature: (0~50) ℃ Relative humidity: ≤ 85% (non condensing) | ||
| Storage environment | Temperature: (-20~60) C Relative humidity: ≤ 85% (non condensing) | ||
| Protection level | IP65 | ||
| Shape size | 220mm×165mm×60mm (H×W×D) | ||
| Fixed mode | Wall hanging type | ||
| EMC | Level 3 | ||
In addition, water quality monitoring reports can serve as a valuable educational tool. They can help raise public awareness about the importance of water quality and the impacts of pollution. By making this information accessible to the public, individuals and communities can become more informed and engaged in water conservation efforts.
In conclusion, water quality monitoring reports are a cornerstone of water management and environmental protection. They ensure the safety of our water supplies, protect public health, contribute to the sustainable management of natural resources, and advance scientific understanding. As such, it is crucial that we understand and appreciate the importance of these reports. By doing so, we can all play a part in preserving our most vital resource, ensuring a safe and sustainable future for all.
Interpreting and Implementing Findings from Water Quality Monitoring Reports
Water quality monitoring reports are essential tools in the management and protection of our water resources. They provide valuable data on the physical, chemical, and biological characteristics of water, which are crucial in determining its suitability for various uses and its impact on the environment and public health. However, the information contained in these reports can be complex and technical, making it challenging for non-experts to interpret and implement the findings.
The first step in interpreting a water quality monitoring report is understanding the parameters measured. These typically include temperature, pH, turbidity, dissolved oxygen, and concentrations of various substances such as nutrients, metals, and bacteria. Each parameter provides specific information about the water’s condition. For instance, high levels of nutrients can indicate pollution from agricultural runoff or sewage, while low levels of dissolved oxygen can suggest a lack of aeration or an overabundance of organic matter.
Next, it’s important to compare the measured values with standard or guideline values. These standards, set by regulatory bodies such as the Environmental Protection Agency (EPA) in the United States or the World Health Organization (WHO) internationally, define the acceptable limits for each parameter in different types of water, such as drinking water, recreational water, or water for aquatic life. If the measured values exceed these limits, it indicates a potential water quality issue that needs to be addressed.
However, interpreting the data is not just about identifying problems. It’s also about understanding the underlying causes and potential impacts. For example, if a report shows high levels of bacteria in a river, it’s important to consider possible sources of contamination, such as nearby livestock operations or failing septic systems. Similarly, if the pH of a lake is decreasing, it could be a sign of acid rain, which can harm aquatic life and damage buildings and monuments. Understanding these connections can help in developing effective solutions.Once the findings have been interpreted, the next step is to implement them. This involves taking action based on the data to improve water quality and protect public health and the environment. The specific actions will depend on the issues identified and their causes. For instance, if a report reveals high levels of nutrients in a lake, possible measures could include implementing best management practices for agriculture to reduce runoff, upgrading wastewater treatment facilities, or restoring wetlands to absorb excess nutrients.
| CCT-3300 | ||||
| Constant | 10.00cm-1 | 1.000cm-1 | 0.100cm-1 | 0.010cm-1 |
| Conductivity | (500~20,000) | (1.0~2,000) | (0.5~200) | (0.05~18.25) |
| μS/cm | μS/cm | μS/cm | MΩ·cm | |
| TDS | (250~10,000) | (0.5~1,000) | (0.25~100) | —— |
| ppm | ppm | ppm | ||
| Medium Temp. | (0~50)℃(Temp. Compensation : NTC10K) | |||
| Resolution | Conductivity: 0.01μS/cm;0.01mS/cm | |||
| TDS: 0.01ppm | ||||
| Temp.: 0.1℃ | ||||
| Accuracy | Conductivity:1.5%(FS) | |||
| Resistivity: 2.0%(FS) | ||||
| TDS:1.5%(FS) | ||||
| Temp:±0.5℃ | ||||
| Analog Output | Single isolated(4~20)mA,instrument/transmitter for selection | |||
| Control Output | SPDT relay,Load Capacity: AC 230V/50A(Max) | |||
| Working Environment | Temp: (0~50)℃;Relative humidity: ≤85%RH(none condensation) | |||
| Storage Environment | Temp:(-20~60)℃; Relative humidity ≤85%RH(none condensation) | |||
| Power Supply | DC 24V/AC 110V/AC 220V±15%(for selection) | |||
| Dimension | 48mm×96mm×80mm (H×W×D) | |||
| Hole Size | 44mm×92mm (H×W) | |||
| Installation | Panel mounted, fast installation | |||
In addition to these direct actions, implementing the findings also involves communication and education. It’s important to share the results with stakeholders, including local communities, policymakers, and water users, and to explain what the data means and why it matters. This can help raise awareness of water quality issues, promote responsible water use, and garner support for necessary measures.
Moreover, water quality monitoring is not a one-time activity but a continuous process. Regular monitoring is needed to track changes over time, assess the effectiveness of implemented measures, and detect new issues. Therefore, interpreting and implementing the findings from water quality monitoring reports should be part of an ongoing commitment to safeguarding our precious water resources.
In conclusion, water quality monitoring reports are a vital tool in the stewardship of our water resources. Interpreting and implementing their findings requires a solid understanding of the measured parameters, a comparison with standard values, an analysis of the underlying causes and impacts, and a commitment to taking action. Through this process, we can ensure the health of our water bodies and the communities that depend on them.